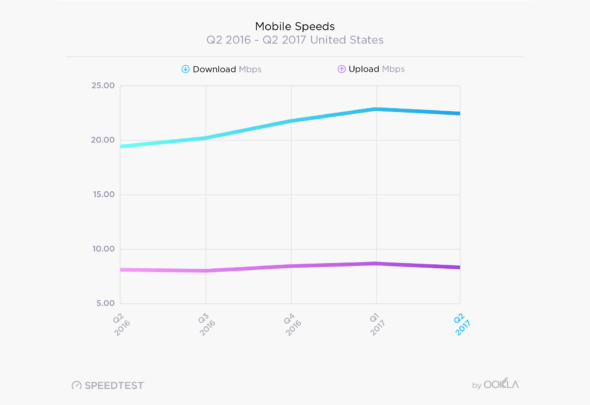
 T-Moble and Verizon Wireless were the two big winners of the 2017 U.S. Market Report by Ookla, which measures broadband performance for wireless networks. Overall, Ookla’s data found that U.S. mobile broadband download speeds have increased by 19% during the past year to reach 22.69 Mbps. Rural mobile broadband speeds lag the national average.
The speed scores assess performance for both upload and download speeds. Average upload speeds increased slightly to 8.51 Mbps, a 4% improvement. Percentage improvements in both download and upload speeds were smaller than in previous years. U.S. global rankings slipped as a result, with the U.S. now ranked 44th globally, down from 42nd for Q1-Q2 2017.
The Speedtest Intelligence results are based on input from the first half of 2017. Almost 3 million mobile devices were used to conduct more than 14 million customer-initiated cellular network tests.
Ookla introduces the concept of acceptable speed ratio (ASR) into their data, which sets 5 Mbps download as a benchmark for minimum required for an acceptable mobile broadband experience. The ASR percentage measures all data samples that meet or exceed the minimum 5 Mbps benchmark.
Ookla found an average rural mobile broadband speeds of 17.93 Mbps, which is 20.9% slower than the national average. This translates into an ASR of 69.6% in rural service areas (RSAs) compared to a national ASR average of 74.9%. Metropolitan service areas had an ASR of 76.2%.
Carrier Performance
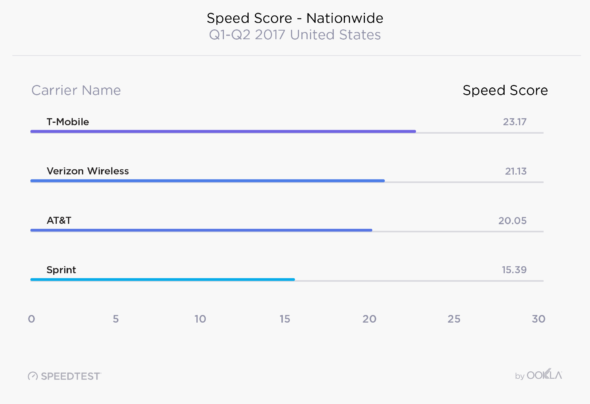
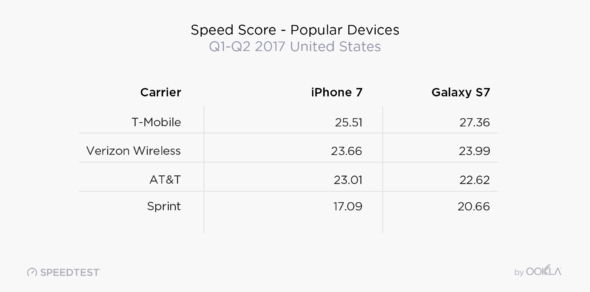
The best performing wireless carriers were T-Mobile and Verizon Wireless, according to the report. T-Mobile had an ASR of 78.1% nationally, with a speed score of 23.17 Mbps. Verizon Wireless won the top 100 cellular market area (CMA) category with an ASR of 79.8%. T-Mobile’s top 100 CMA score was 77.9%, while Verizon Wireless had a national average of 77.8%. AT&T (75.9% nationally, 76.5% in the top 100 CMAs) and Sprint (64.9% nationally, 66% top 100 CMAs) brought up the rear.
Verizon was most impacted by its larger, but slower rural footprint, since it served 51.6% of rural test participants. AT&T had little more than half at 27.3%. T-Mobile and Sprint followed at 11.5% and 9.6%, respectively. It is not a statistic winner for Verizon, since its larger share of the slower areas brings down its national average, Ookla says.
Ookla concluded that mobile performance is improving, but not in a uniform manner. The report looks forward. Data consumption and consumer feature demand will continue to grow and carriers must find ways to improve their networks. This includes densification, use of 4-layer MIMO, more efficient modulation schemes, and opening of new licensed and unlicensed spectrum.
Ookla counsels carriers to push adoption of Gigabit LTE devices and suggests that this is happening. “Most importantly, smartphones have a key role to play in network efficiency,” the report concludes. “Highly efficient devices with 4-branch antenna diversity and sophisticated RF Front End will continue to proliferate the marketplace.”