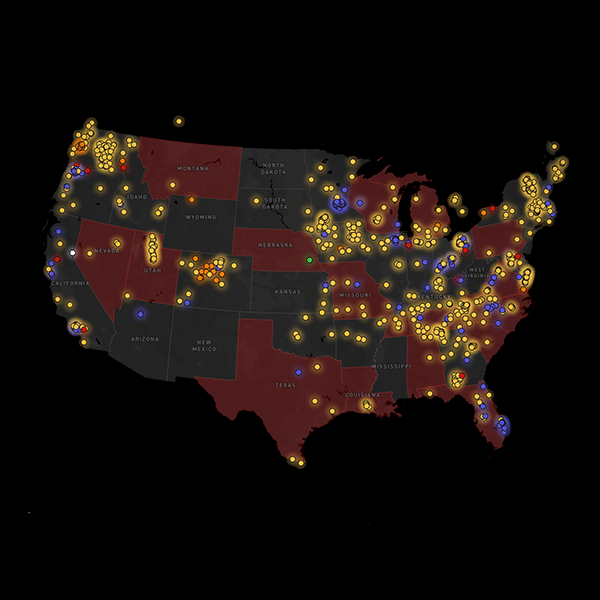
The number of municipal broadband networks in the U.S. is continuing to grow, according to a new interactive community networks map created by the Institute for Local Self-Reliance (ILSR).
The map pinpoints the location of these municipal networks and offers a graphical illustration of emerging trends. Because the map is interactive, users can explore the various types of municipal broadband networks that span the U.S.
“At first glance, it’s striking to see just how many communities have decided to solve their own local connectivity challenges by building publicly owned, locally controlled networks after being left behind or neglected by the big monopoly Internet service providers,” said Ry Marcattilio, associate director for research with ILSR’s Community Broadband Networks Initiative.
The map also shows more detailed trends, including:
- The rising number of municipal broadband networks: Between 2001 and 2008, an average of six new municipal networks came online per year, a figure that has jumped to 15 annually in the last decade.
- The 16 states that still restrict or ban cities from building and operating their own telecommunications infrastructure. But that figure is down from 19 three years ago, as Washington, Arkansas, and Minnesota have removed their restrictions.
- More municipal broadband networks are serving their neighbors: Utah’s UTOPIA Fiber serves 22 different communities. EPB Fiber in Tennessee serves nine. In Vermont, partnerships among more than 200 communities has greatly increased the number of publicly owned broadband networks.
- Iowa, Massachusetts, and Tennessee boast the highest number of municipal broadband networks in the nation.
- The number of open-access networks has increased, with nearly 200 communities served by such a network.
Beyond the map it just launched, ILSR is working to ensure the accuracy of broadband maps for U.S. municipalities and other entities.